Interactive WebMap, Nizhny Novgorod/RU
Cities Building Culture, RWTH Aachen University
The Cities Building Culture project in Nizhny Novgorod involved extensive research into civil engagement dynamics aimed at preserving and enhancing residential heritage. Key components of the research included creating detailed 2D maps using QGIS, which documented monuments, building timelines and locations relevant to civic initiatives in the city. Additionally, an interactive WebMap was developed using QGIS and Javascript, designed to be published on the CBC website, facilitating public engagement with the mapped data. Data scraping with Python and management with SQL targeted social media websites VK and Twitter, resulting in the collection of 13,200 posts which provided valuable insights into public sentiment, initiatives and actions related to heritage conservation.
Nizhny Novgorod Civic Actions
© 2023 Mehmet Haydan, Copyright Cities Building Culture Project/RWTH Aachen University
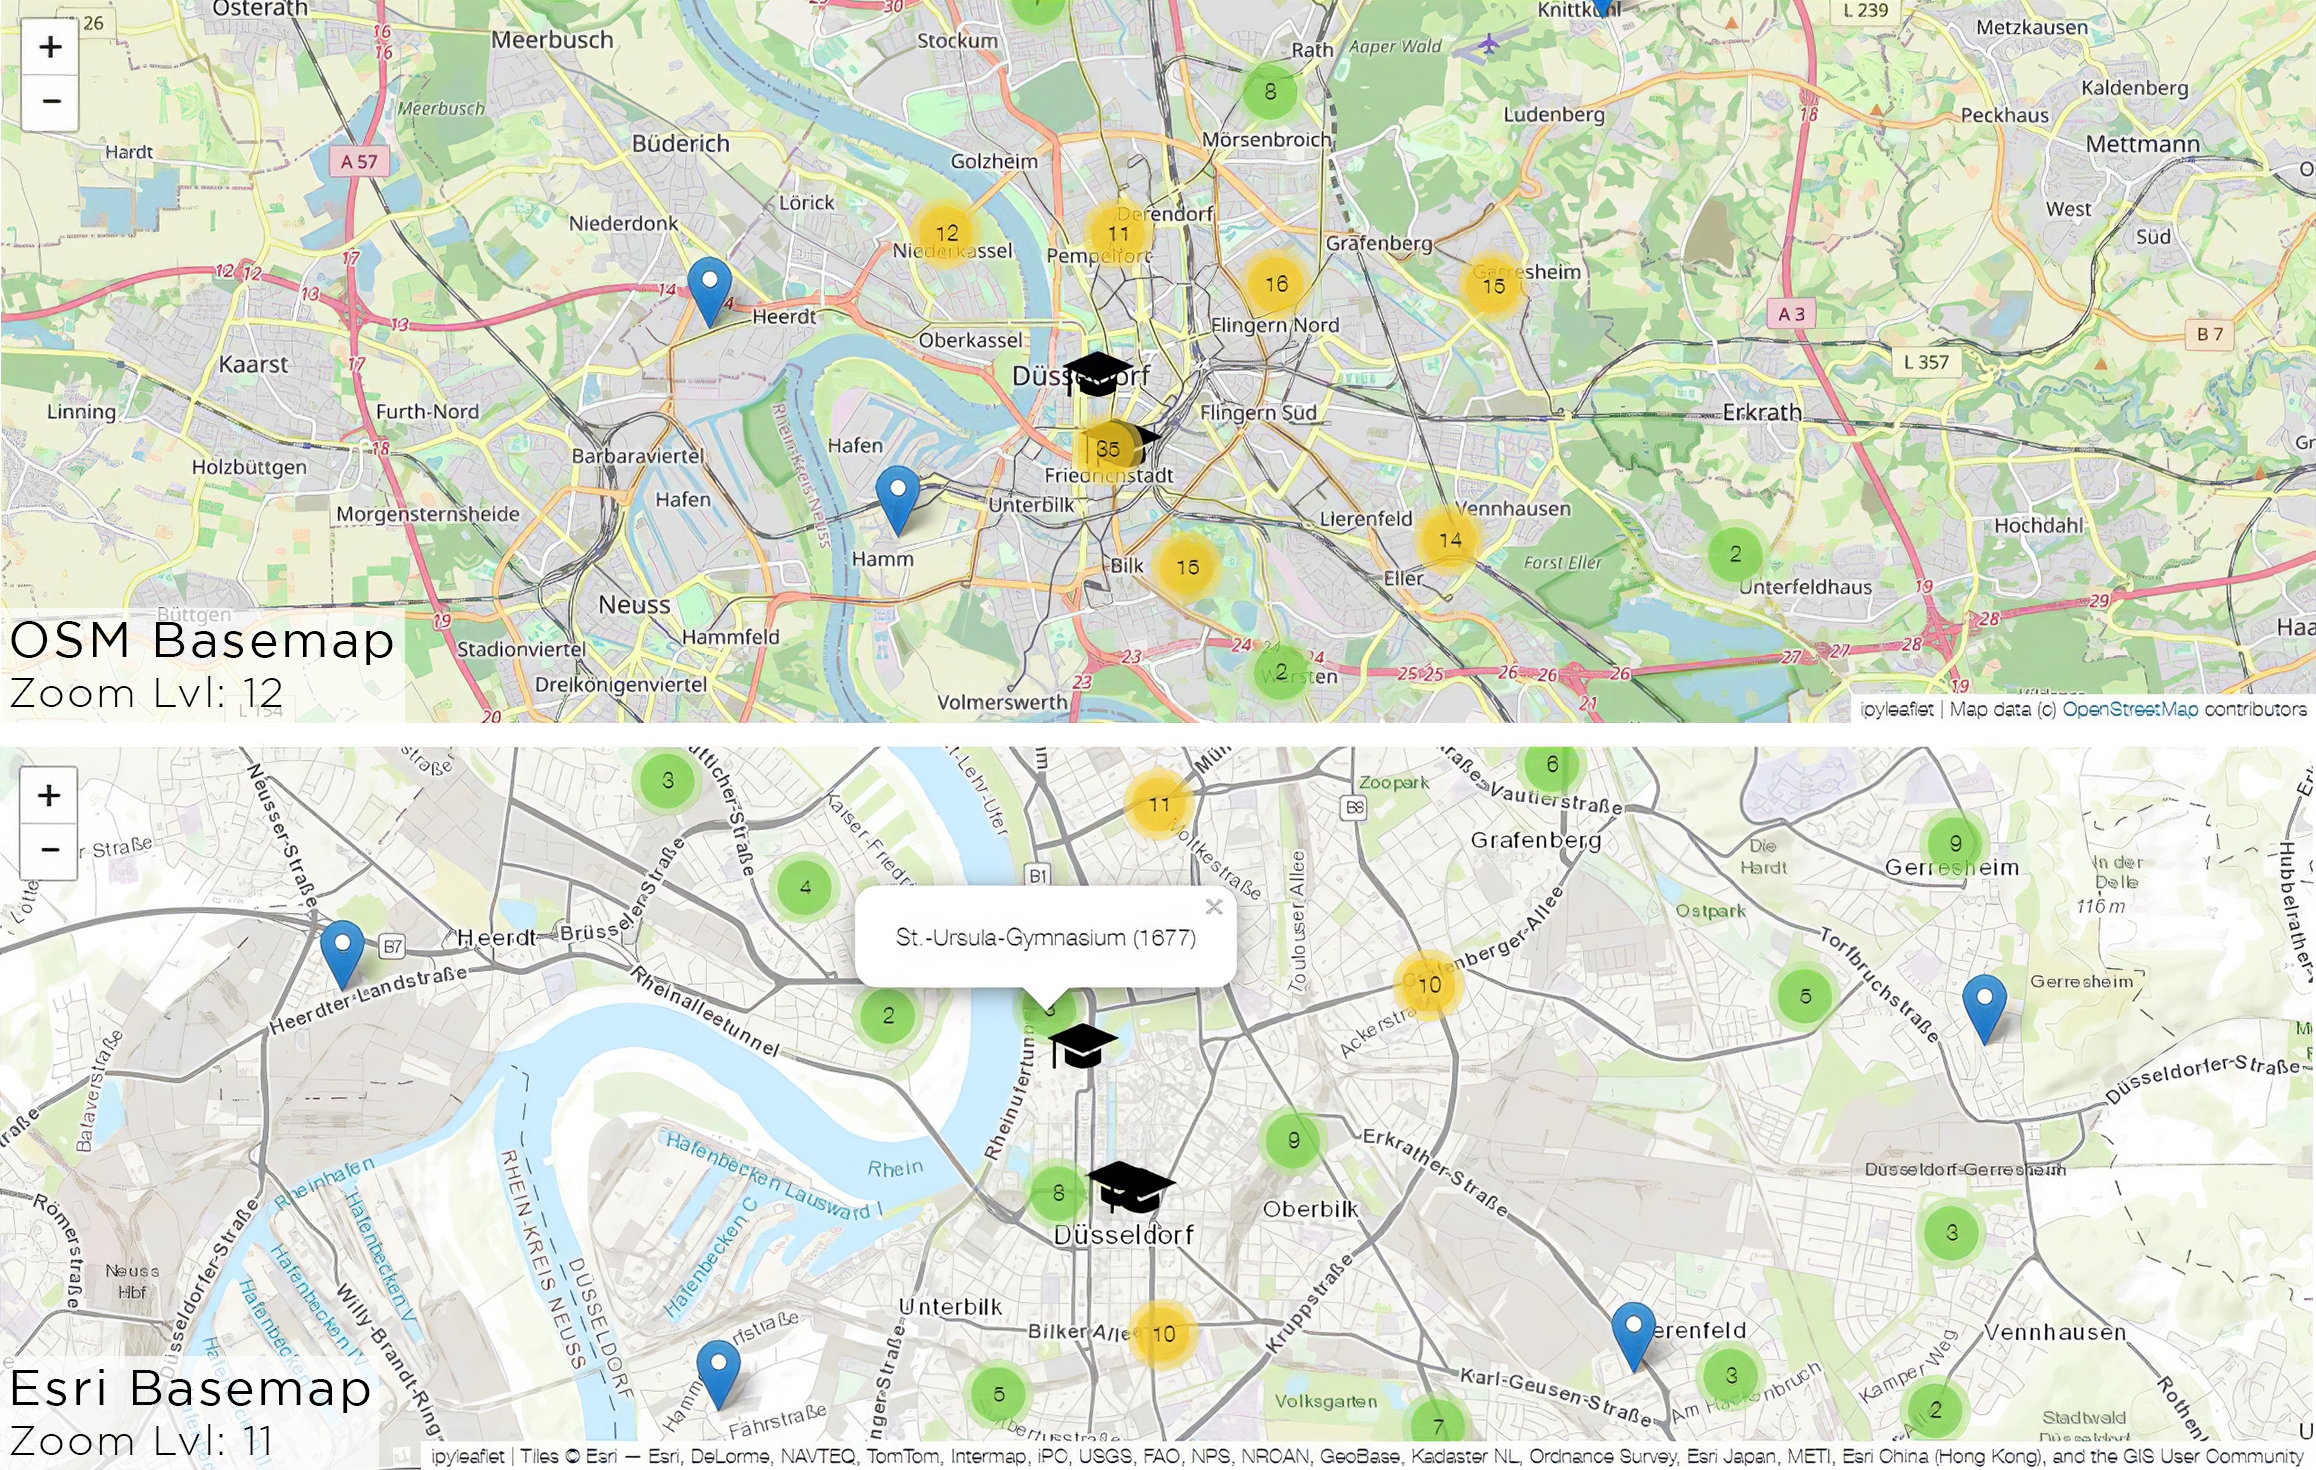
Spatial Data Manipulation with iPython, Düsseldorf/DE
Territorial Analysis, M.Sc.
The project aimed at improving skills on the language using Jupyter Notebooks as a tool with ipyleaflet. The main goal was to create an interactive map which shows the oldest three schools in Dusseldorf. The chosen dataset included necessary informations such as coordinates and names of the schools for further programming. The GeoJSON file was imported and printed with plot functions in GeoPandas library package. NumPy and MatPlotLib libraries were also used in the process. Finally, the point data was coded to cluster and click-open with including location informations within Osmnx.
Preview of the Final Product/Oldest Schools in Düsseldorf
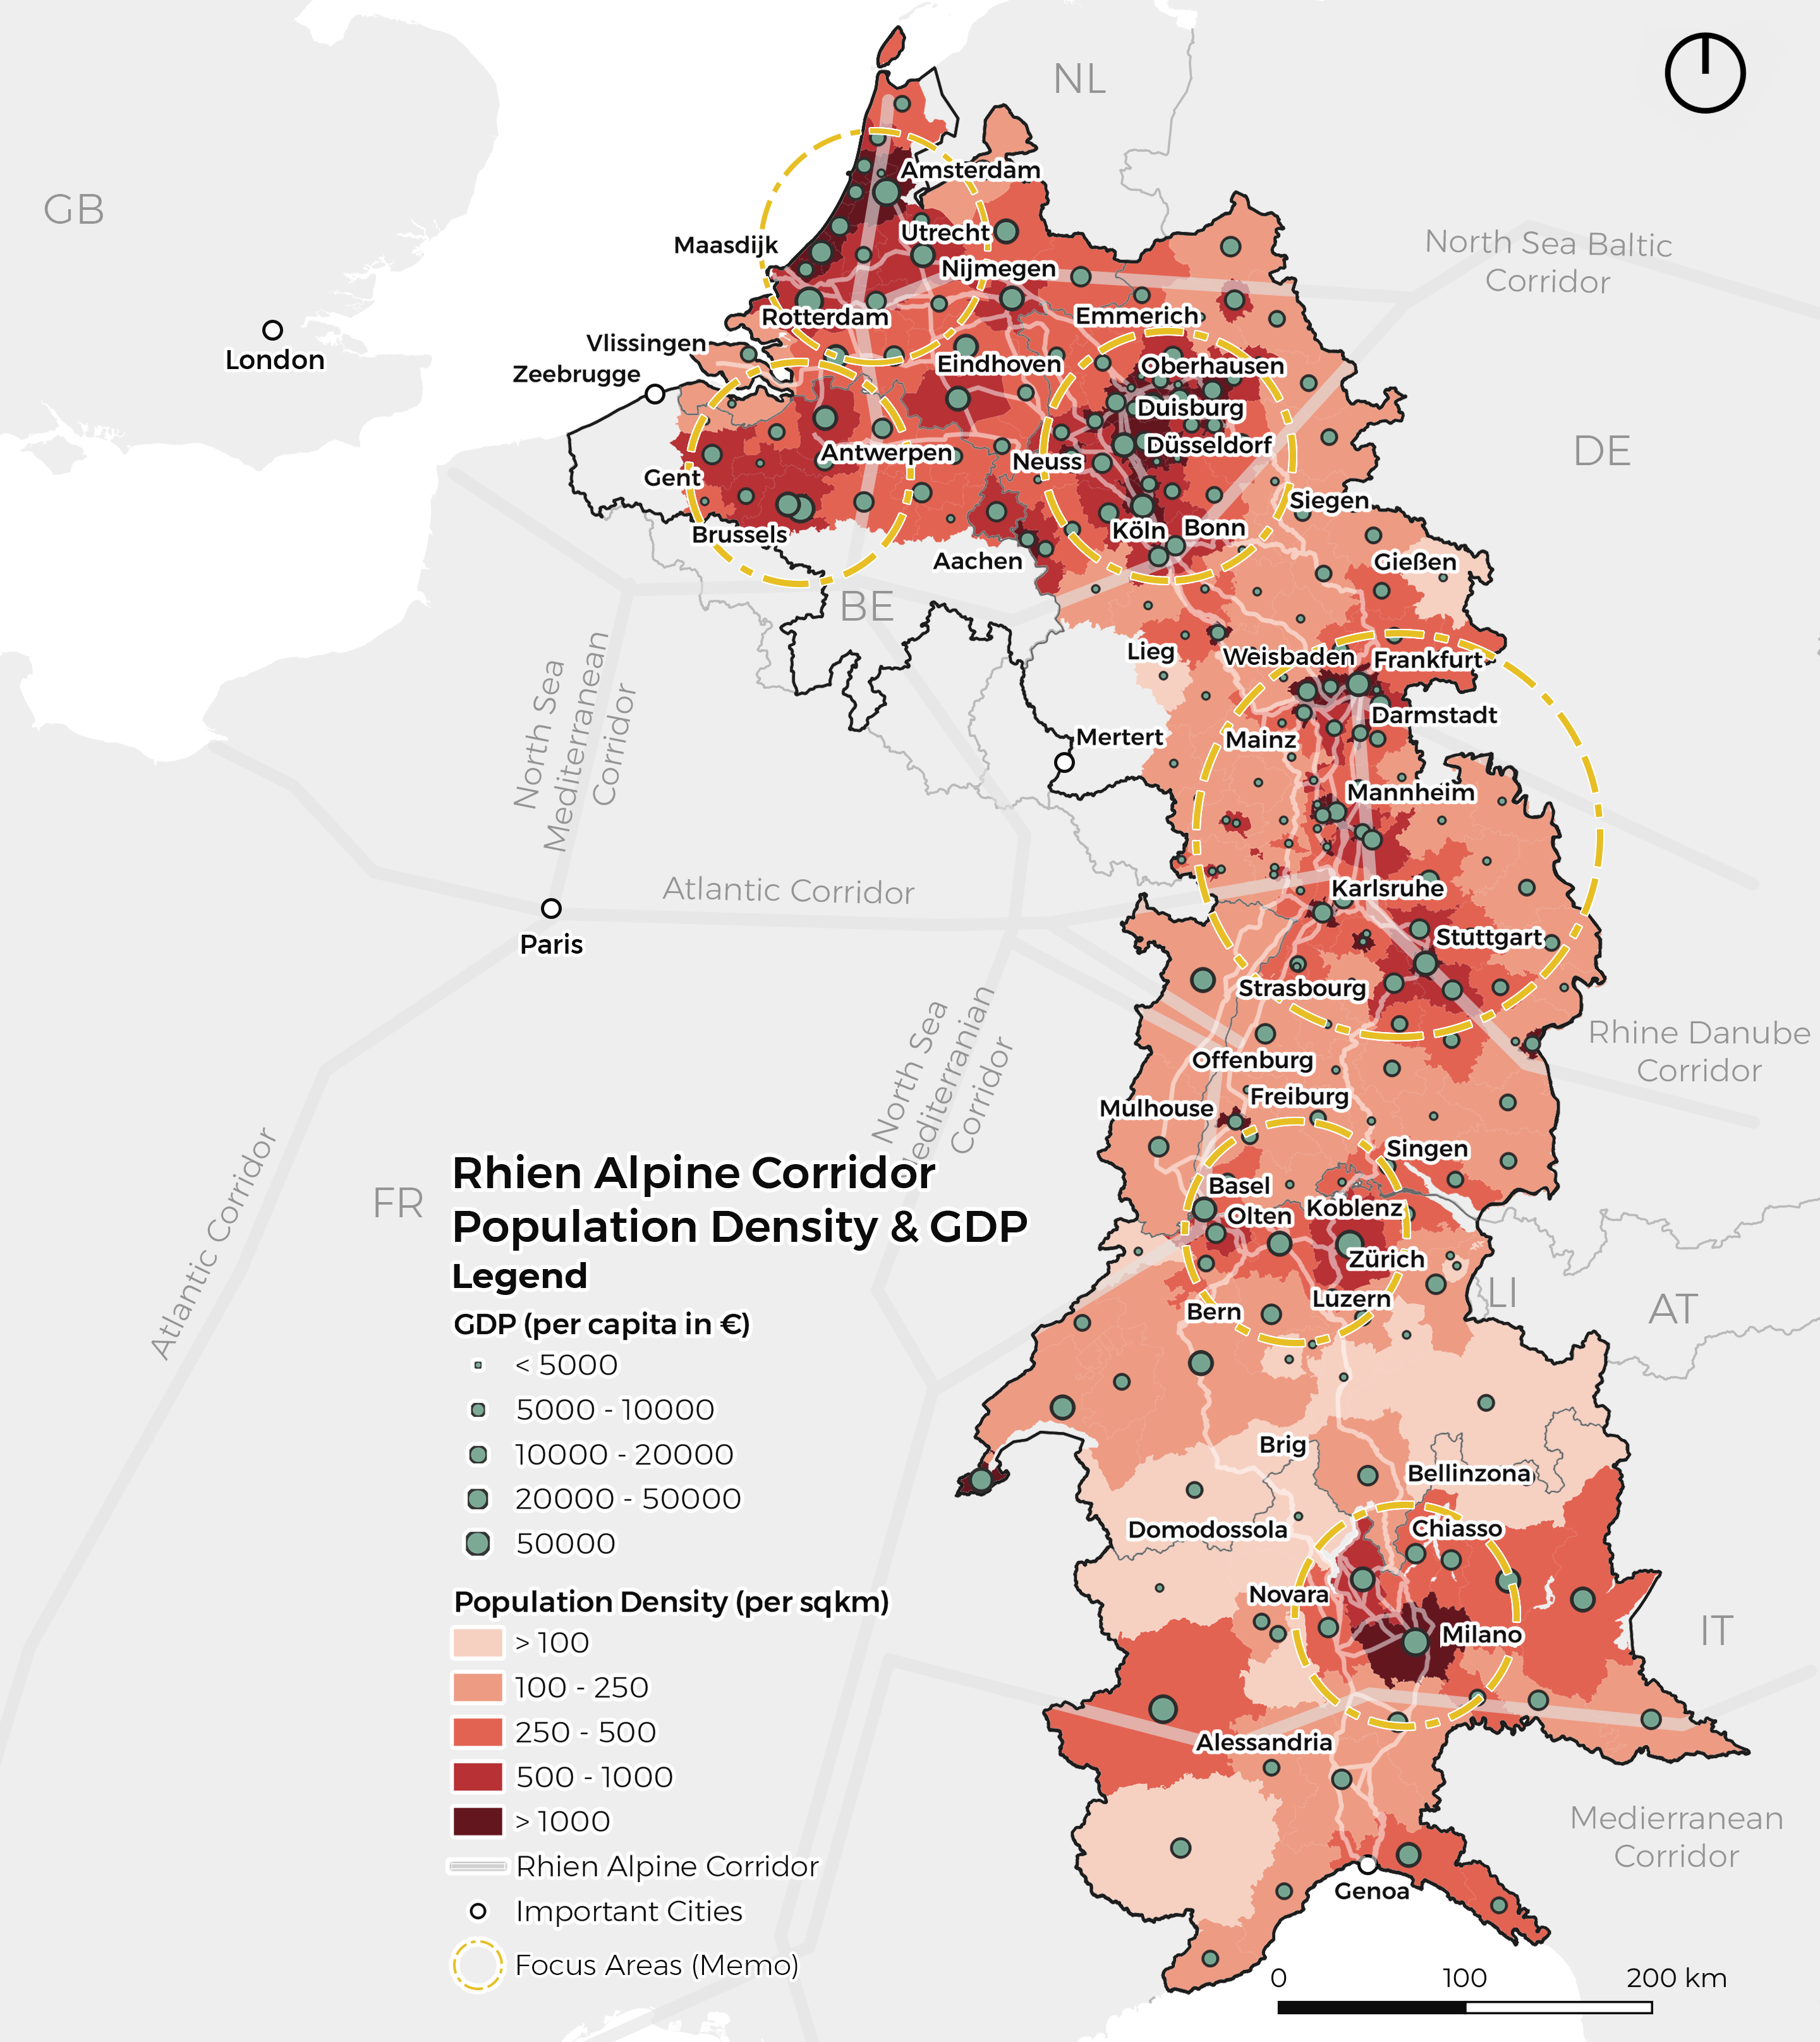
GDP & Density Analysis, Rhein-Alpine Corridor/EU
Integrated Project III, M.Sc.
The Rhine Alpine Corridor is a key economic region in Europe, featuring several large urban centers. This concentration of economic activity, however, results in challenges such as inequality, traffic congestions, high housing costs and environmental degradation. Using GIS, these issues were analyzed, particularly focusing on low-income settlements in high-density areas like Oberhausen and Liege, which struggle with access to opportunities and social cohesion.
Population Density / GDP per capita
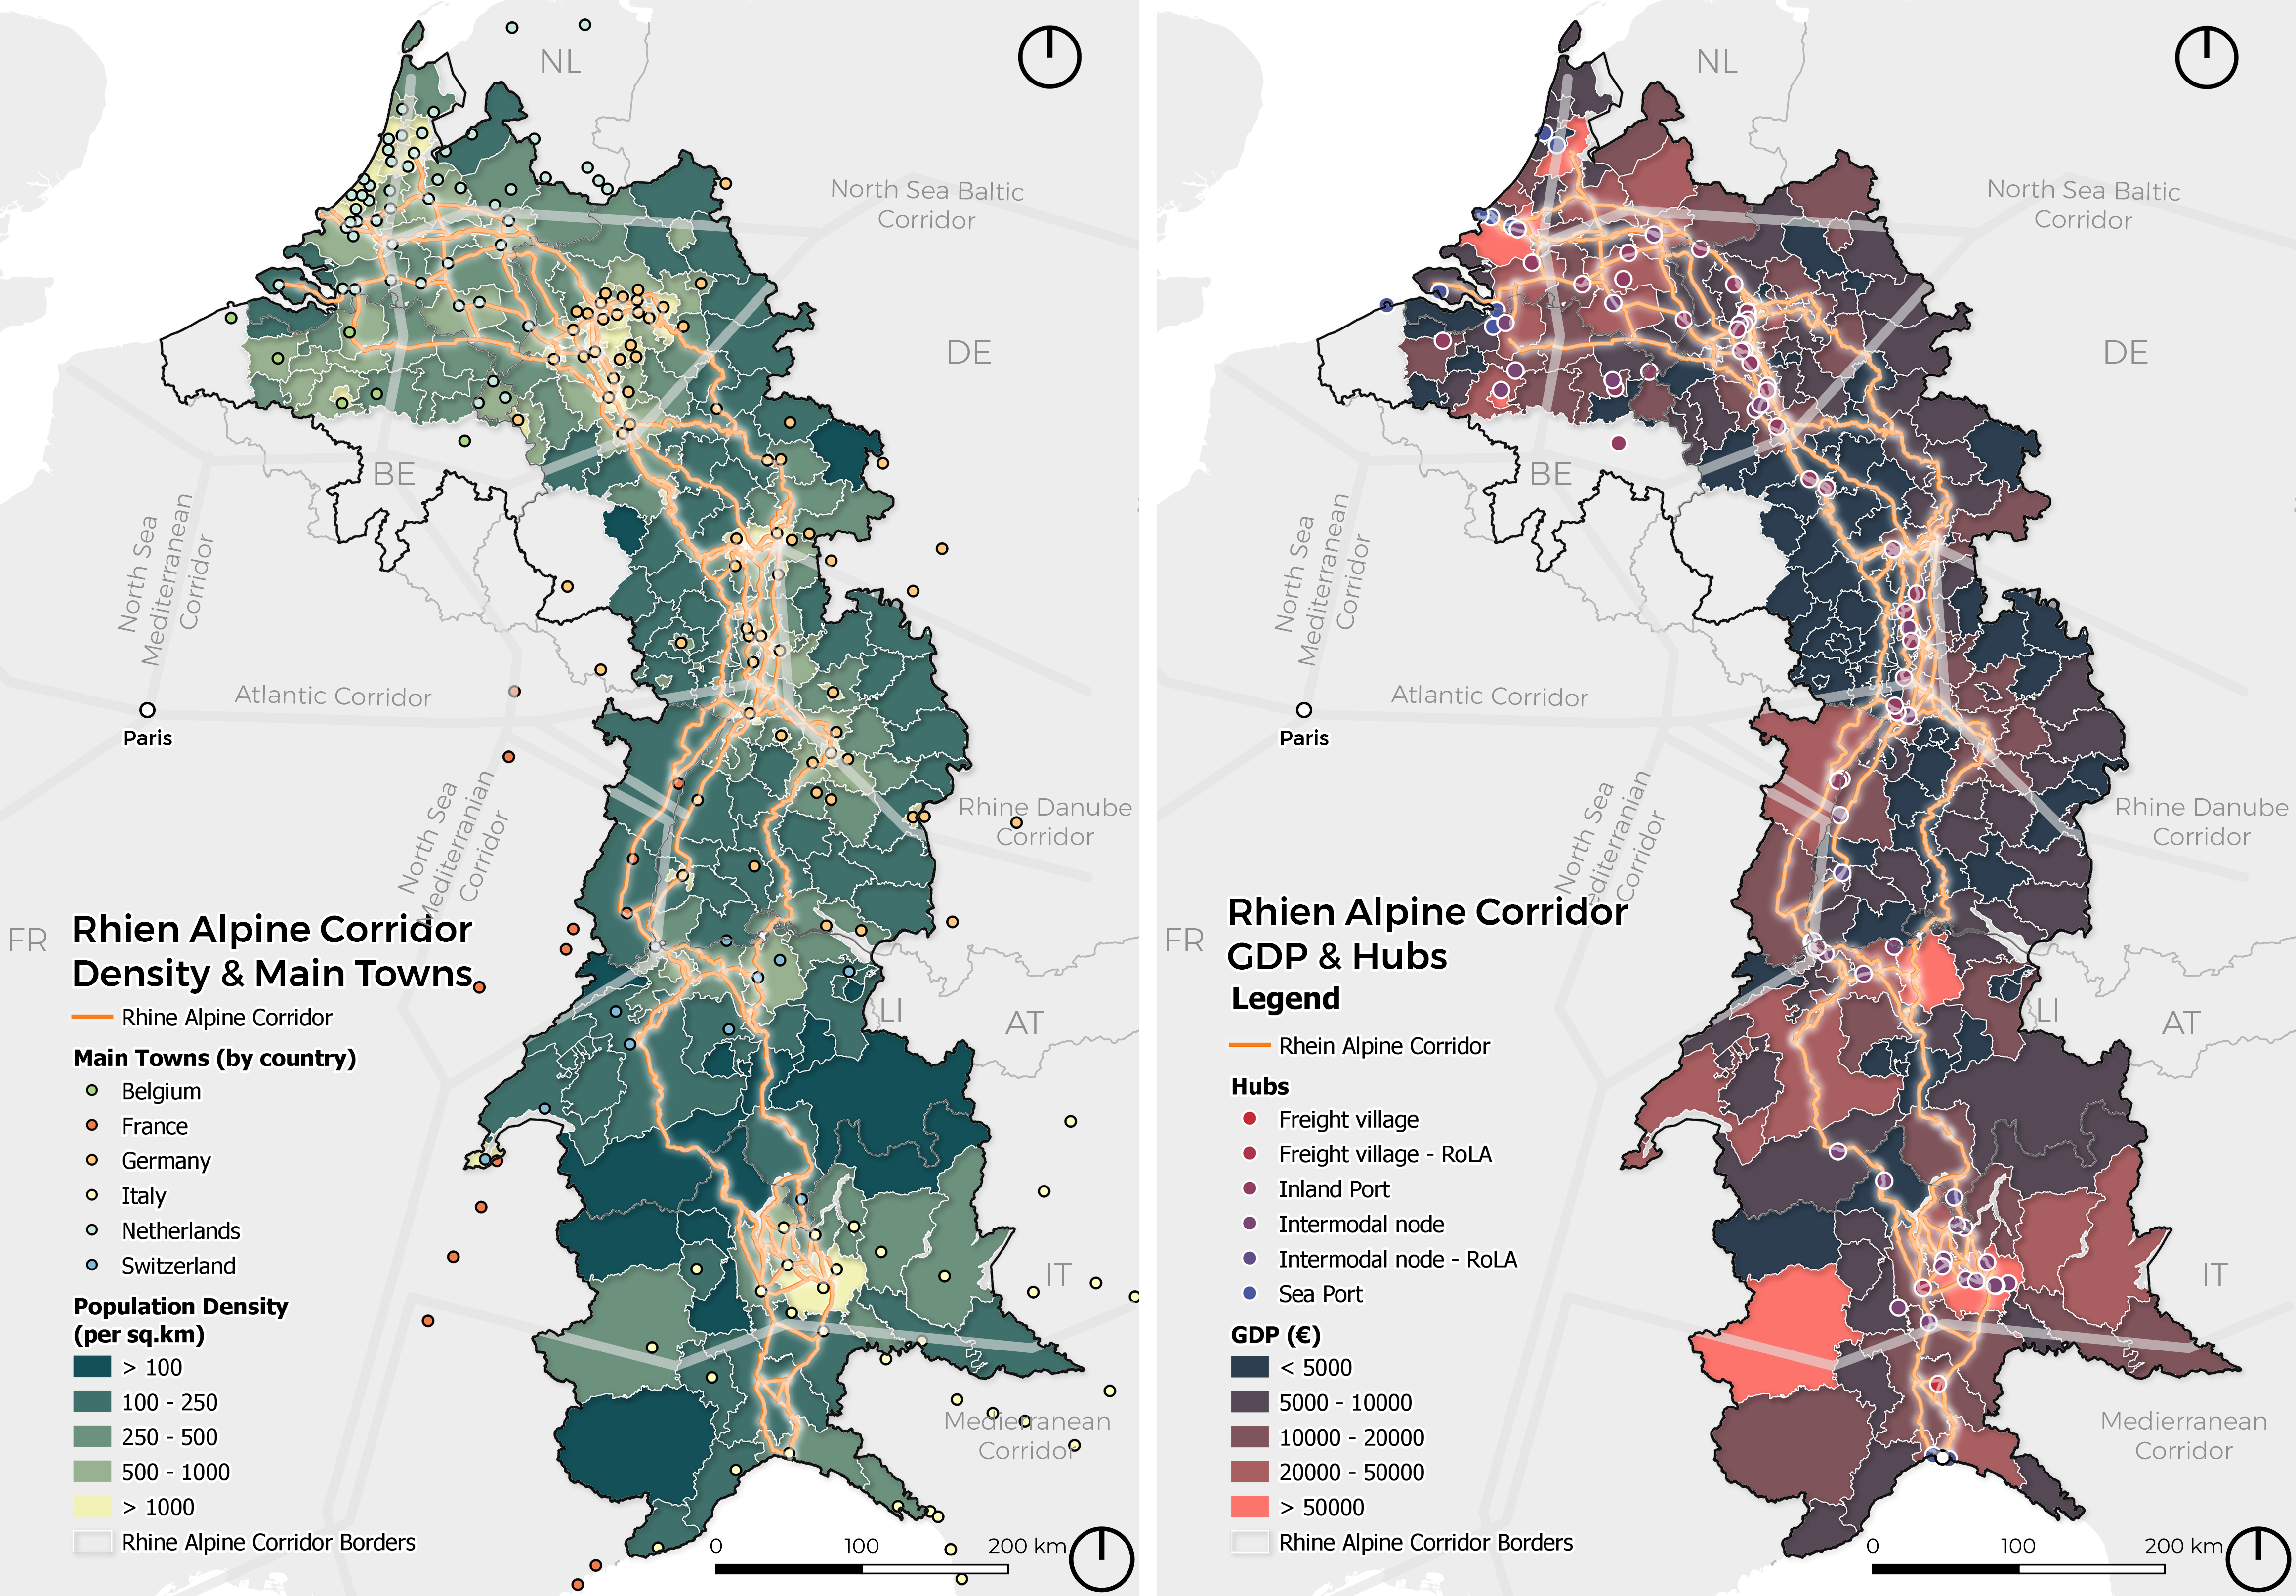
The analysis explored strategies for balanced regional growth, including polycentric urban development to create multiple economic centers and reduce central concentration. Targeted industrial developments in low-income areas were also examined to address economic disparities. GIS mapping and spatial analysis helped identify key areas for infrastructure investments, such as high-speed rail links, improved public transportation networks, affordable housing and community facilities. These investments were tailored to the unique needs of diverse communities within the regions, considering their historical and ethnic backgrounds in the further analysis.
Combined Mapping
⦿ Click for the project report! ⦿
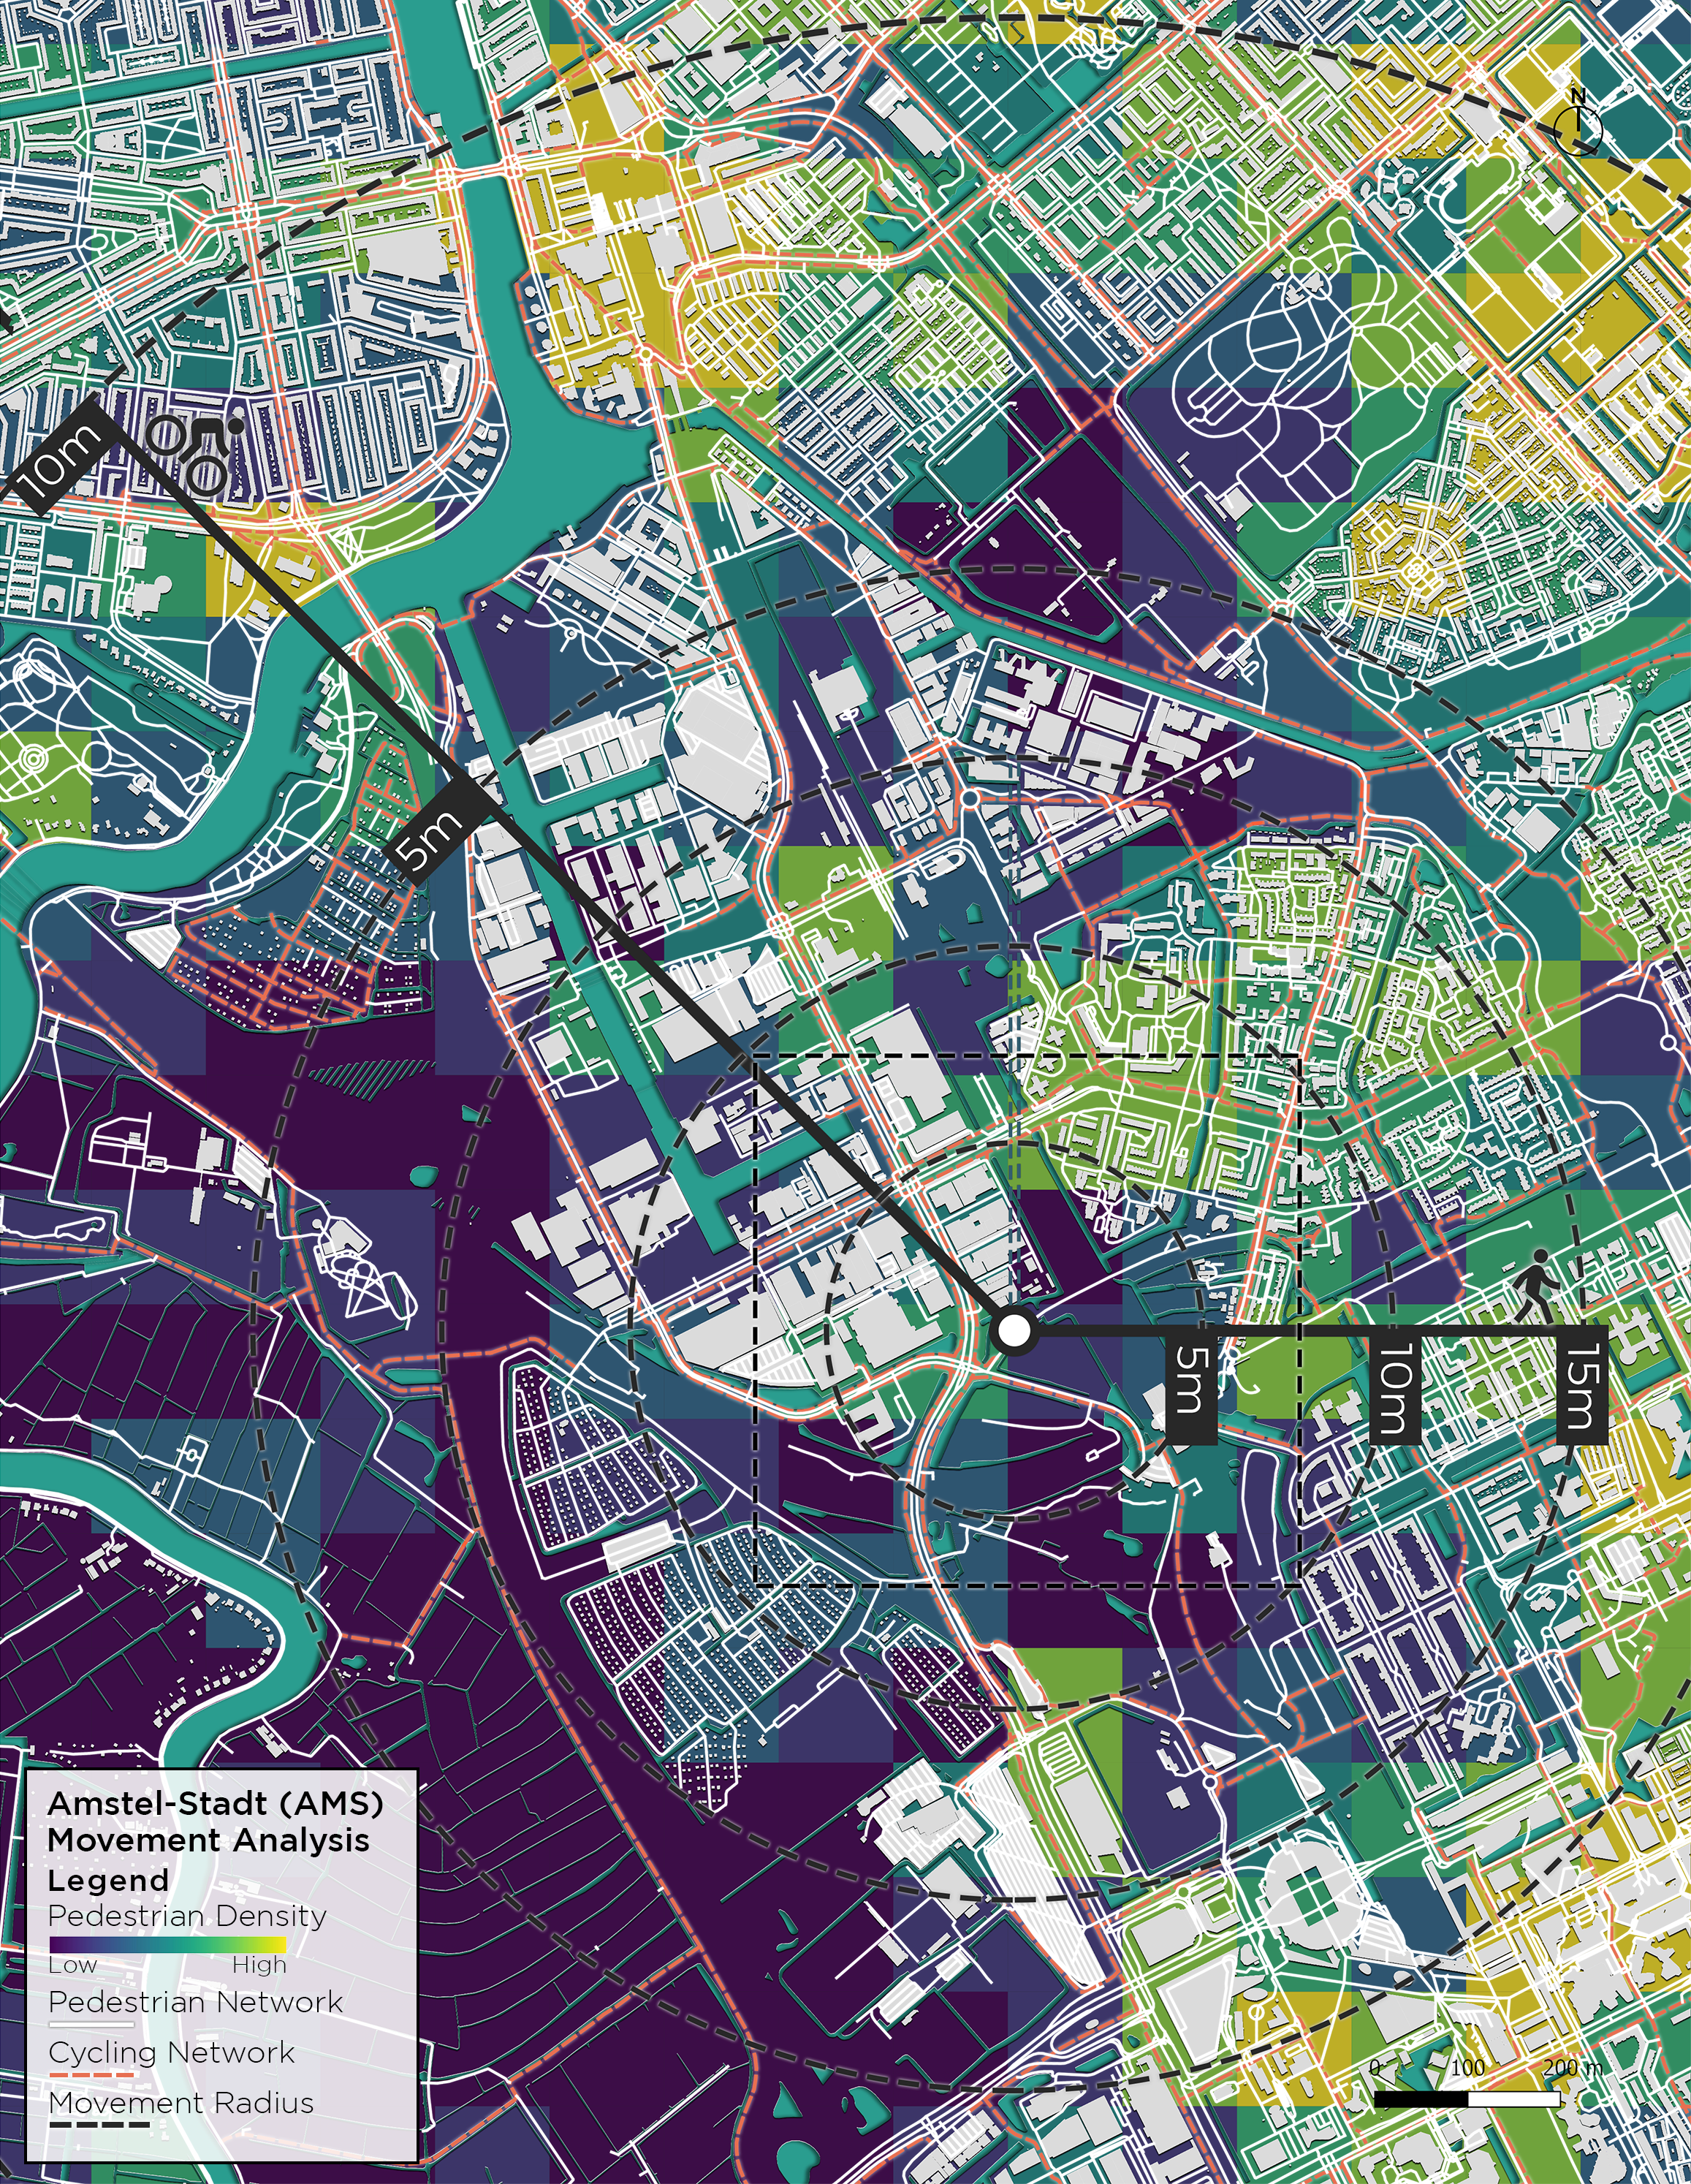
Movement Analysis, Amsterdam/NL
Integrated Project II, M.Sc.
The analysis was created in Amstel-Stadt region of Amsterdam and it integrates several layers of analysis, including walking distances (5, 10, and 15 minutes radius) and cycling distances (5 and 10 minutes radius), as well as the existing cycling and pedestrian networks. Additionally, it assesses pedestrian movement density based on potential movement projections derived from the number of pedestrian connections. This multi-layered analysis aimed to provide a detailed understanding of movement patterns and connectivity within the area for further development.
Movement / Accessibility Analysis
⦿ Click for the project report! ⦿
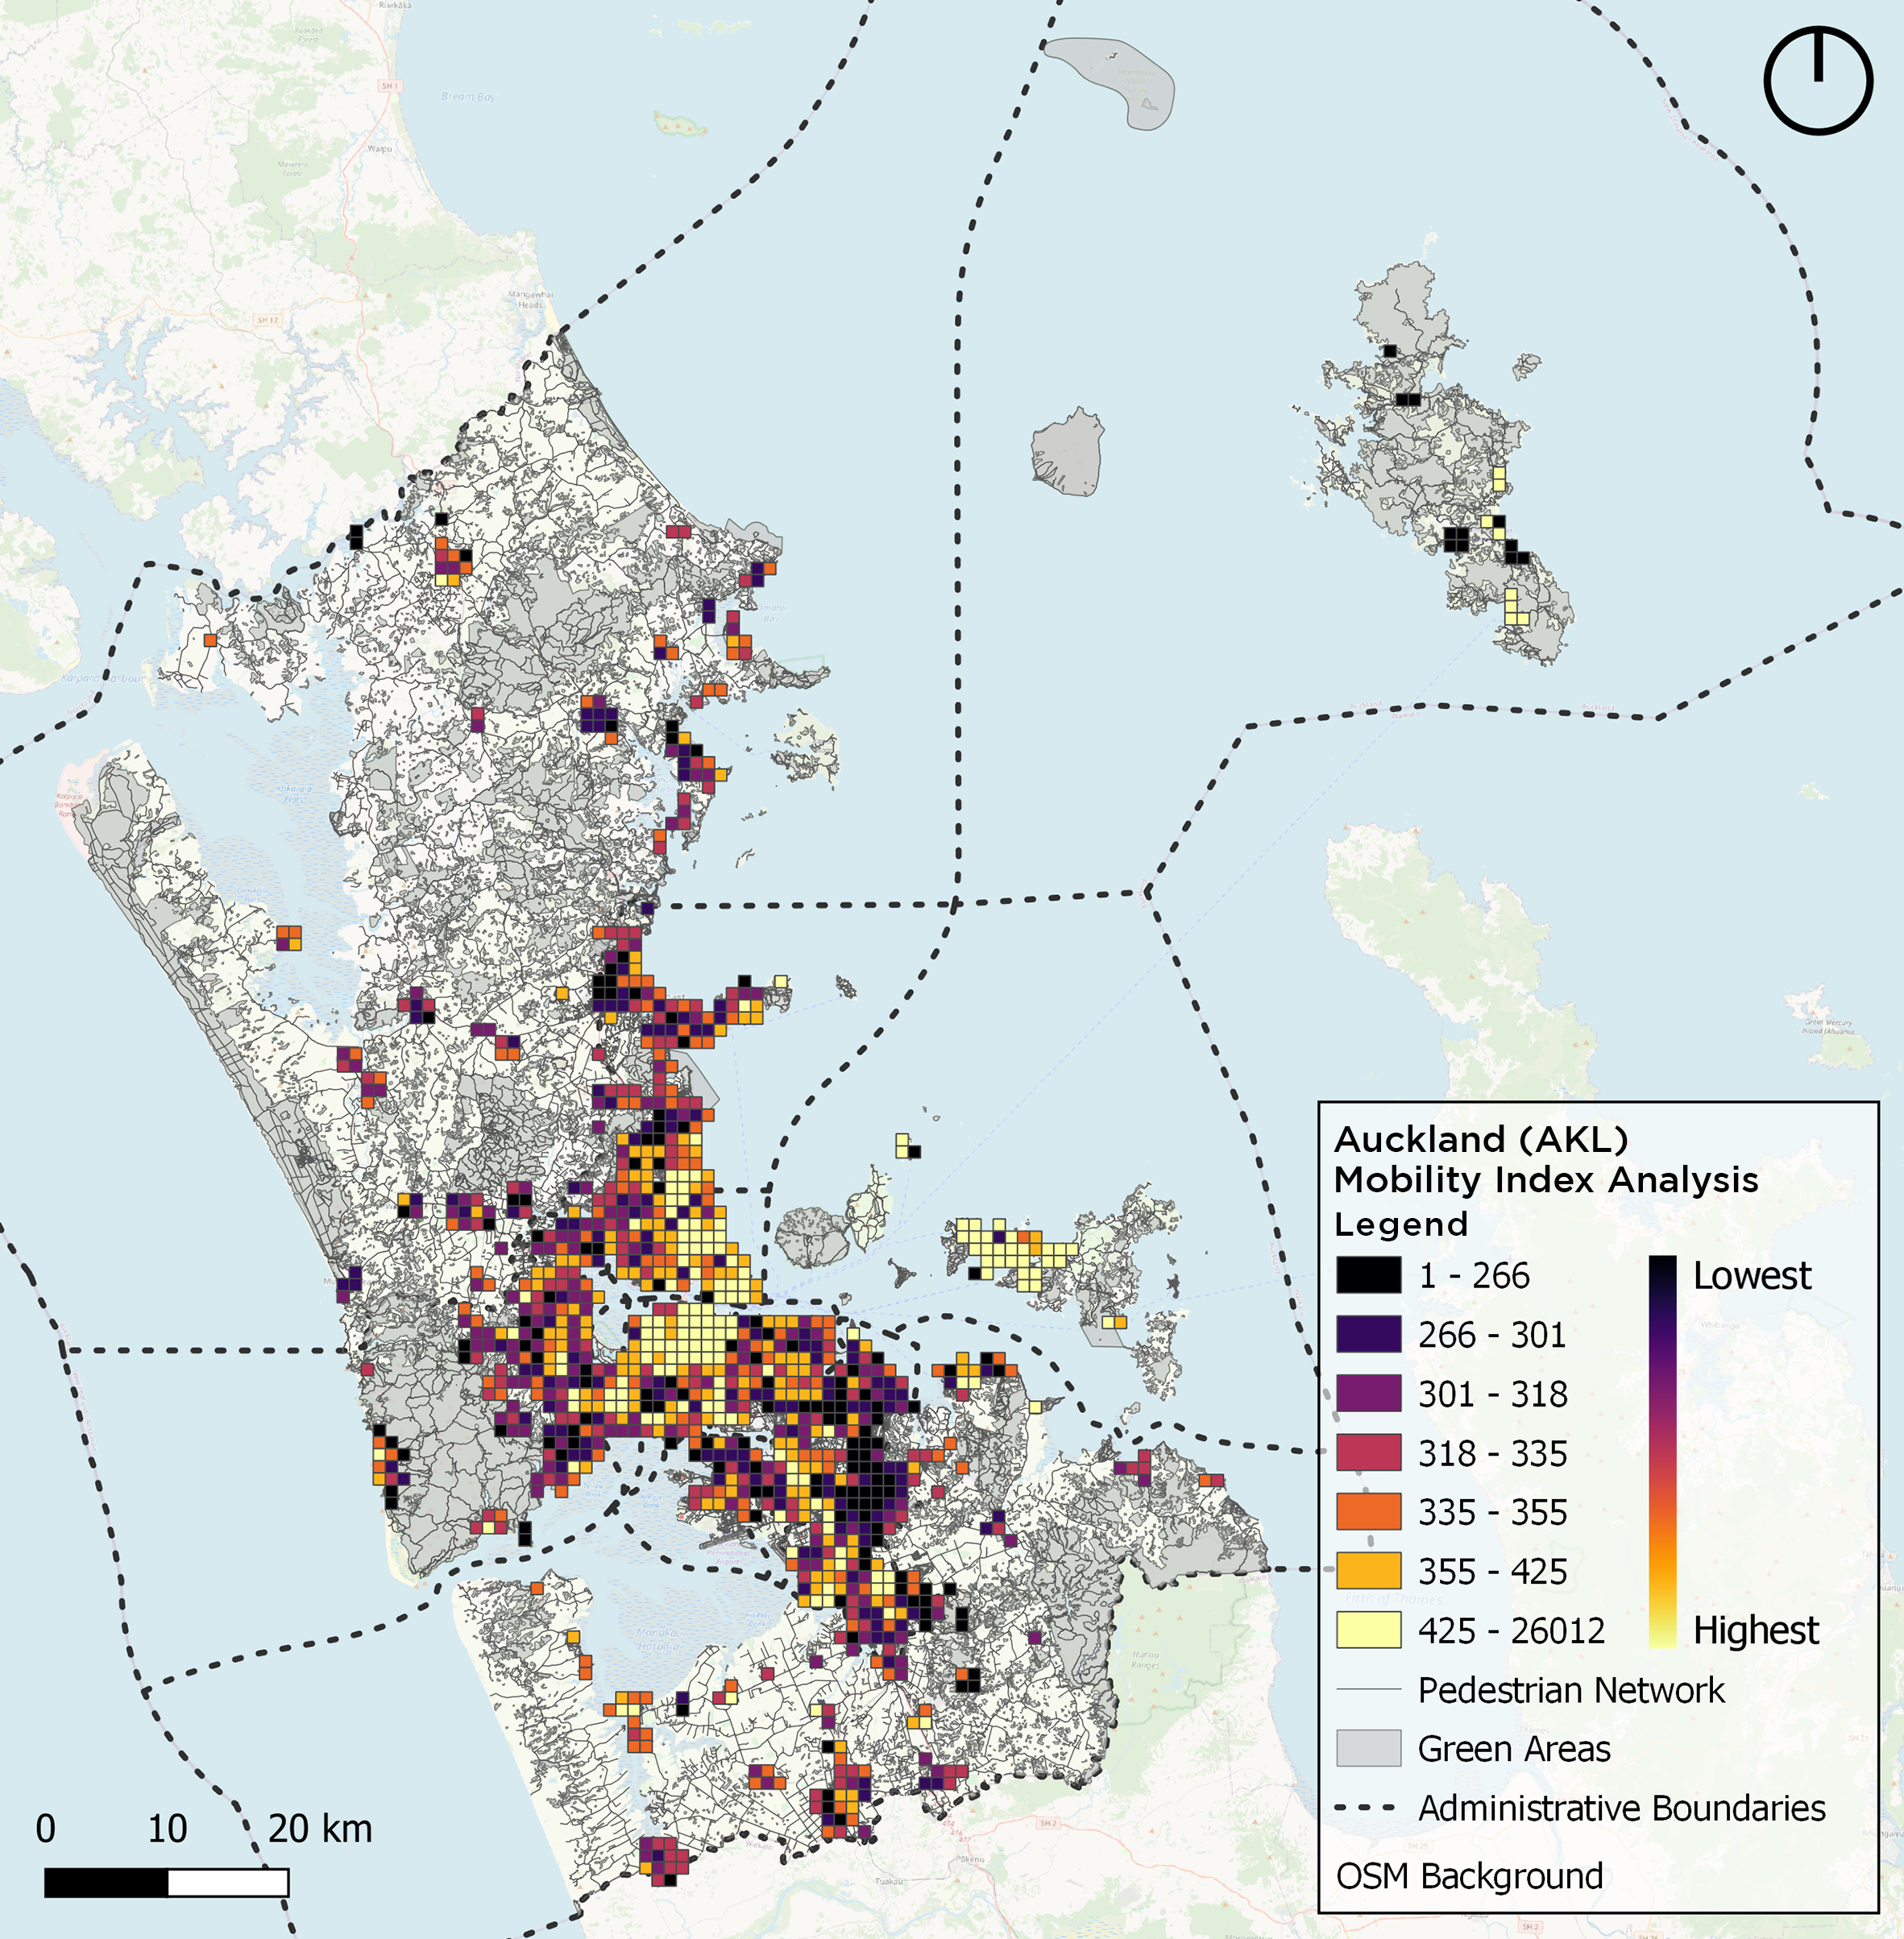
Mobility Index Analysis, Auckland/AUS
Mobility Research and Transport Modeling, M.Sc.
The project focuses on the evolving urban landscape towards pedestrian and bike-friendly spatial development in Auckland, influenced by the rise of remote work trends. Emphasizing the importance of essential amenities like retail, gyms and cafes within residential areas, the research aims to measure walkability by examining how pedestrians are integrated into city planning and the factors that shape pedestrian spaces. To form the walkability/mobility index, Auckland's spatial distribution was analyzed, alongside studying pedestrian behavior and urban development trends. This index, calculated within a 1.5 km radius, incorporates accessibility to the essential facilities, availability of public transport, quality of pedestrian infrastructure and safety considerations. The final report details the methodologies employed, including GIS-based analyses, with each factor strategically weighted: Accessibility Index (x1.3), Transport Index (x1.5), Quality Index (x1) and Safety Index (x1.3).
Mobility Index Auckland